In the first blog post in this series, Introduction to Mobility Data Specification (MDS), we discussed what MDS is and broke down the specification.
For micromobility programs that are getting set up with MDS or looking to ensure their data aligns with the spec, there are a lot of ways it can diverge; some are more critical than others. They all start with the question: how do you know if your data adheres to MDS?
MDS has strict requirements about the shape of the data. Below you’ll see the correct measures compared to the common mistakes we see:
- Currency: 100 cents instead of one dollar
- Battery level: 0.36 rather than 36%
- Timestamp: milliseconds instead of seconds
In addition to incorrect denominations, sometimes data is just outright wrong. It’s not uncommon to see coordinates swapped or baselines be incorrect, such as an incorrect clock giving inaccurate times for trips.
Measuring the health of your data feed is important. We’ve developed a feed health report within the Ride Report app that helps cities and operators understand how close their data is to spec. It points out issues, helps operators debug their feeds, and helps cities understand the quality of the data they’re getting from operators.
Challenges of Mobility Data Specification
The core of data challenges in micromobility are due to variances in interpretation. Some of them are rather cut and dry, allowing for a simple, programmatic solution. But sometimes operators use fields differently than anticipated.
For example, the cost is supposed to be a positive value, but sometimes operators will indicate a refunded ride with a negative number. It may make sense to the operator, but it doesn’t fit the spec.
The types of data collected can vary by vendor. Some operators omit certain events. Some operators will decide not to serve unavailable events, which makes it more difficult to present accurate information. For example, if 300 vehicles are available at the onset, but there are no unavailable events, we have no way of knowing if there are actually only 200 vehicles available.
Authentication and rate limiting, which every operator does differently, can also cause issues with data. Rate limiting is the number of requests we can make to an API in a given time frame. If exceeded, you get an error message. Sometimes there will be limits on data that can be obtained after a period of time, for example, 30 days. If we’re working with a city and want to show them further back than that, there may not be a way to do that.
Factors that impact mapping the state of the street into a data feed
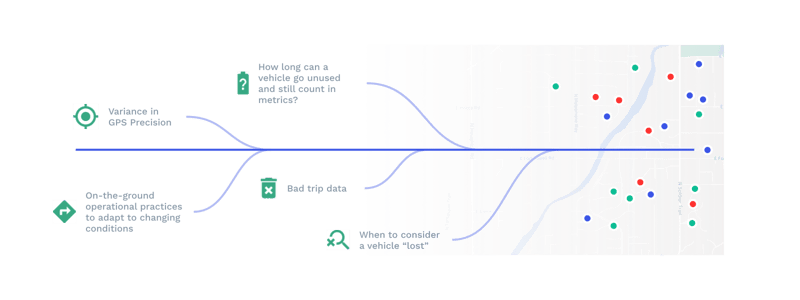
There are a number of considerations that go into representing the state of a street as a data feed.
Variance in GPS Precision
Most micromobility service areas are urban. Elements in those landscapes, such as tall buildings, presence of wifi, etc. can obscure GPS data. We’ve also seen different coordinates provided by GBFS and MDS.
When to consider a vehicle “lost”
The answer to this question varies broadly across operators. Some have a time-based threshold, for example, if a vehicle doesn’t ping their servers in a 48-hour period, it is marked as unavailable or lost. In some instances the vehicle is indeed lost, but often it is still on the street, but has an issue with its battery, water damage, or some other fault that prevented a signal from being sent. This is particularly challenging because often the only data you have is its last known location and an operator physically checking is the only way to know whether it is truly lost.
How long can a vehicle go unused and still count in metrics?
Seasonality is a factor in frequency of vehicle use, especially in climates that vary dramatically over the year. In spring and summer months, you would expect shorter average periods of unuse, versus winter, where vehicles may go unused for longer stretches of time. Ride Report is working with the Open Mobility Foundation (OMF) to improve the data available and remove some of the guesswork. We operate under the assumption that if we have not received any status events from a vehicle in 7 days that the vehicle is no longer available.
On-the-ground operational practices to adapt to changing conditions
There are instances where operators need to respond quickly to changing conditions on the ground, resulting in compromised data integrity. One Florida city was preparing for a hurricane and asked operators to remove its scooters from the streets. They did so, but were inconsistent in scanning the devices, resulting in inaccurate information about where scooters were and what their status was.
Bad trip data
Extreme inaccuracies in trip data are not always difficult to identify, but more minor ones can be challenging. We recently analyzed data that raised some flags, including very long trips. We thought it was possibly the result of manfunctioning GPS, but we discovered some of these trips — for example Rio De Janeiro to Lisbon, was the result of operators rebalancing vehicles across the globe without properly scanning them.
Read part 3 of our MDS series about what to do when the data itself is bad.
Our white paper 4 ways cities can put mobility data to work will equip you to better lead your program, define goal metrics, and generate revenue.